The book-to-bill ratio is one of those industry benchmarks that quietly shapes decision-making in sectors where supply and demand shift rapidly. While often associated with the semiconductor and technology markets, it applies to other industries as well, such as aerospace and defense. This metric essentially compares the number of new orders a company receives against the number of orders it fulfills within a given period. By looking at this ratio, investors, analysts, and managers gain insights into whether demand is growing, shrinking, or staying steady.
What the Book-to-Bill Ratio Represents
At its simplest, the book-to-bill ratio measures the relationship between incoming business and completed sales. “Bookings” represent the orders customers commit to purchasing, while “billings” refer to the revenue recognized when the company ships and invoices for those orders. By comparing the two, businesses can see whether demand is outpacing supply or if they are clearing through existing backlogs. A ratio above 1 indicates stronger demand, suggesting that more orders are coming in than are being shipped. A figure below 1 reveals that shipments exceed new orders, often pointing to declining demand or companies fulfilling earlier commitments. A ratio exactly equal to 1 reflects a balance where supply meets current demand without excess backlog or undersupply.

How the Ratio Is Calculated
The formula for determining the book-to-bill ratio is straightforward: Book-to-Bill Ratio = Orders Received ÷ Orders Shipped. For example, if a manufacturer books 600 new orders during a month but ships only 500, the ratio is 1.2. That means demand is running ahead of supply, which could indicate growing interest in the company’s products or limited production capacity. On the other hand, if the business ships 700 units but only books 500, the ratio is 0.71, suggesting that it is clearing existing inventory and not securing as many new orders. This calculation is often carried out monthly or quarterly, depending on how quickly demand fluctuates in the industry.
Why the Ratio Matters
The book-to-bill ratio matters because it offers a real-time glimpse into market health. For companies in cyclical industries like semiconductors, the ratio acts as an early warning sign. A consistently high ratio may signal that the market is heating up, encouraging expansion or investment. Conversely, a sustained low ratio may point to softening demand, guiding firms to scale back production or delay new investments. For investors, this metric helps assess whether a company is well-positioned to grow. A company with a consistently high book-to-bill ratio may benefit from strong customer interest, while a firm with a ratio below 1 could be struggling to attract new business.
Interpreting Different Scenarios
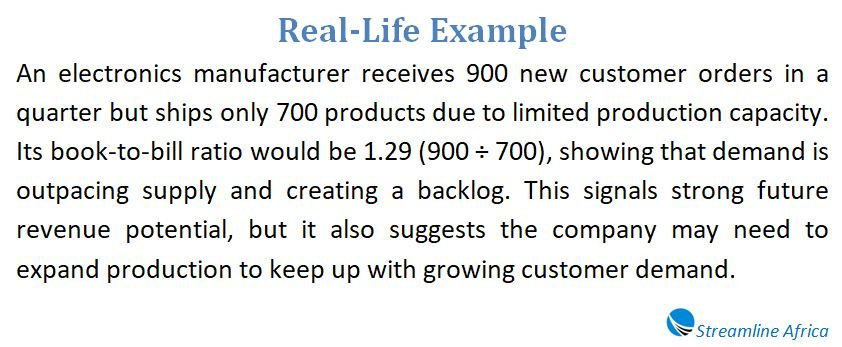
The meaning of the ratio depends on whether it’s above, below, or equal to 1. Each scenario reveals something different about a company’s situation: A ratio above 1 means demand exceeds supply. This can be positive for future growth but may also highlight capacity constraints. For instance, if a company books 1,000 orders but only ships 800, it has a ratio of 1.25. The excess orders become backlog, which could translate to future revenue. A ratio below 1 means supply exceeds demand. This may indicate slowing business activity. If a company ships 1,200 orders but books only 900, the ratio is 0.75. That suggests the company is clearing old orders and may face fewer incoming sales in the near term. A ratio equal to 1 means supply and demand are balanced. When bookings match billings, companies are meeting customer needs efficiently without building up a backlog or falling behind.
Real-World Example of the Ratio in Use
A useful illustration of this metric in practice comes from ASMPT Limited, a Hong Kong-based manufacturer specializing in semiconductor and electronics equipment. In April 2024, the company reported that its book-to-bill ratio had risen above 1 for the first time in seven quarters. This shift was attributed to a 17% increase in bookings, driven primarily by demand in the semiconductor and surface-mount technology markets. For investors, that development signaled a rebound in demand for equipment, suggesting that the broader technology sector could be heading into a growth phase after a period of weakness.
Bookings Versus Billings: The Core Distinction
To fully understand this ratio, it’s important to distinguish between bookings and billings. Bookings reflect customer commitments—orders placed but not yet delivered. Billings, by contrast, are realized sales, recognized when goods or services are delivered and invoiced. The difference is crucial because a company may record strong bookings without seeing immediate revenue, especially if there are production delays. Similarly, strong billings with weak bookings may indicate that while the company is completing past sales, it is not securing enough future business.
What Constitutes a Good Ratio?
A book-to-bill ratio greater than 1 is generally interpreted as a positive sign, as it suggests demand is stronger than supply. However, context matters. A high ratio might reflect robust demand, but it could also highlight challenges in keeping up with production. In such cases, a high ratio may not automatically translate into higher profits if bottlenecks prevent timely delivery. A ratio of 1 is often seen as ideal because it shows that the company is meeting demand as it arises without creating backlogs. For industries where stability is valued, such as defense contracting, a balanced ratio can be a sign of operational efficiency.
Why Ratios Below 1 Happen
Companies may find themselves with ratios below 1 when they fulfill more orders than they receive in a given period. This often happens when businesses are shipping out backlog from previous months. While this might temporarily boost revenues, it may also reflect declining demand in the current market. If this trend continues, it could point to a slowdown that managers and investors need to monitor carefully. For example, if a company books 400 new orders but ships 500, the resulting ratio of 0.8 suggests that unless new orders increase, future revenues could decline.
Industry Applications Beyond Technology
Although the ratio is most commonly associated with the technology and semiconductor industries, it has broader applications. Aerospace, defense, and heavy manufacturing companies also use it to gauge demand and production alignment. In these industries, long lead times and large contracts make understanding order flow especially important. For instance, in aerospace, a book-to-bill ratio above 1 might indicate airlines are ordering more aircraft than manufacturers can deliver within a year, signaling confidence in long-term passenger demand.
Assessing the Broader Significance
The book-to-bill ratio is more than just a statistic—it is a pulse check for industries where demand fluctuates rapidly. Investors look at it to understand where markets may be headed, while managers use it to adjust production schedules and staffing. When viewed alongside other performance indicators like revenue growth, profit margins, and backlog size, it helps provide a clearer picture of a company’s health. Yet, like all ratios, it has limitations. A single month’s figure can be misleading if bookings or billings spike unusually due to a one-off contract. Analysts usually look for trends over several months or quarters to draw meaningful conclusions.
Final Takeaway
The book-to-bill ratio offers a straightforward yet powerful way to evaluate how well companies align supply with demand. A figure above 1 points to rising demand, while a figure below 1 suggests weakening orders. A balanced ratio of 1 reflects operational efficiency in meeting customer needs. Though most often used in semiconductors and technology, its insights extend to industries like aerospace and defense, where long production cycles make understanding order trends vital. For businesses, this ratio informs production planning and resource allocation. For investors, it provides a window into market sentiment and potential growth opportunities. Ultimately, the book-to-bill ratio should not be viewed in isolation but rather as part of a broader analytical toolkit. When combined with financial performance measures and industry trends, it becomes a valuable guide to both current health and future prospects.
FAQs about the Book-to-Bill Ratio
Why is the book-to-bill ratio important?
It shows whether demand is growing, shrinking, or stable, helping managers and investors understand market conditions and company performance.
How is the ratio calculated?
It’s calculated by dividing orders received by orders shipped during a month or quarter.

What does a ratio above 1 mean?
It means demand is stronger than supply, with more new orders being placed than the company can fulfill immediately.
What does a ratio below 1 suggest?
It indicates weaker demand, often showing that the company is completing past orders but not attracting enough new ones.
Why is a ratio of exactly 1 significant?
It reflects balance—orders are being filled as they arrive, with no backlog or shortage, signaling efficient operations.
What’s the difference between bookings and billings?
Bookings are commitments from customers to buy, while billings are completed sales recognized once goods or services are delivered and invoiced.
Can a high ratio be risky?
Yes, while it signals strong demand, it may also reveal that production capacity is stretched and the company risks delays.
Why might a company have a low ratio?
A low ratio usually means shipments are exceeding new orders, often because the firm is relying on past backlogs rather than fresh demand.
Which industries rely most on this ratio?
Technology and semiconductor companies use it heavily, but it’s also key in aerospace, defense, and other industries with long production cycles.
How do investors use this metric?
They use it to spot growth trends, evaluate demand strength, and decide whether a company or sector is likely to expand or slow down.
What is its biggest limitation?
The ratio can be misleading in a single month due to unusual spikes in orders or shipments, so trends over time are more reliable than one-off figures.