
In the world of investing, numbers tell stories. Among these numbers, the price-to-book ratio, often shortened as P/B ratio, stands out as a tool investors use to judge whether a company is being traded at a fair price in relation to what it owns. By comparing a firm’s market value to its book value, this ratio helps investors figure out if a stock might be undervalued or overpriced. It is not a crystal ball, but it does provide a snapshot of how the market values the assets a company reports on its balance sheet.

What the Price-to-Book Ratio Represents
The P/B ratio draws a link between what investors are willing to pay for a company’s stock and the value of its net assets recorded in financial statements. In simpler terms, book value is the worth of everything a company owns after its debts are deducted. When you divide a company’s stock price by the book value per share, you get the P/B ratio.
This number allows investors to see how the market is valuing every dollar of a company’s net assets. A lower P/B ratio can sometimes signal a bargain, while a higher one can point to potential overpricing.
The Formula Behind the Ratio
The P/B ratio calculation is straightforward but powerful. It is expressed as:
P/B Ratio = Market Price per Share ÷ Book Value per Share
Here’s how the pieces fit: Market price per share is simply the current trading price of the company’s stock. Book value per share is calculated by taking total assets, subtracting intangible assets and liabilities, and dividing by the number of outstanding shares. Both sets of numbers can be found in a company’s financial reports, typically available in the “financials” or “balance sheet” section of stock tracking platforms.
Why Investors Pay Attention to P/B Ratios
The main appeal of the P/B ratio is that it gives a quick way to judge whether a stock is selling for more or less than what the company’s balance sheet suggests it is worth. For those looking for undervalued opportunities, a P/B ratio of less than one often signals a company may be trading below its net asset value.
That said, context matters. A company with a low P/B ratio might be cheap for a reason, such as poor growth prospects or weak management. On the flip side, a high P/B ratio could reflect investor optimism about future profits, not necessarily an inflated stock.
How the Market Influences the Ratio
Market forces shape the P/B ratio in real time. For example, when investors have strong faith in a company’s ability to grow, demand for its shares increases, raising the market price and pushing the ratio higher. Conversely, if investors doubt the company’s future, its share price may drop and the ratio falls.
The P/B ratio reflects a mix of current investor sentiment and the accounting realities of the business. While it doesn’t predict future cash flows, it shows what the market currently believes the company’s assets are worth relative to their accounting value.
P/B Ratio and Return on Equity
One way investors give deeper meaning to the P/B ratio is by comparing it with return on equity (ROE). ROE shows how efficiently a company generates profits from shareholder equity. When the P/B ratio and ROE move in alignment, it suggests that the stock’s market valuation makes sense in light of its profitability.
However, a mismatch—such as a high P/B ratio with low ROE—can be a warning sign. It might mean the market is too optimistic about a company that isn’t delivering strong returns.
Differences Across Industries
There is no universal definition of a “good” P/B ratio. Different sectors have different capital structures, levels of tangible assets, and accounting practices. For example, banks and manufacturing firms often have significant tangible assets, making P/B ratios especially meaningful for them. On the other hand, technology or service-based companies, which rely heavily on intangible assets like patents or software, may naturally show higher ratios.
The key is to compare P/B ratios among companies operating in the same industry rather than across unrelated sectors.
Market Value Versus Book Value
A frequent observation is that a company’s market value usually exceeds its book value, resulting in a P/B ratio above one. This often happens because accounting rules require costs like research and development to be expensed immediately, reducing book value. However, those same expenses can create valuable innovations, such as new products or patents, that raise investor confidence and boost market value.
In some situations, particularly when earnings slump, a company’s P/B ratio might slip below one, suggesting its stock is being traded for less than the value of its net assets.
A Simple Example
Imagine a firm with $320 million in assets and $260 million in liabilities. Subtracting the liabilities from assets leaves $60 million in book value. If the company has 15 million shares outstanding, then the book value per share is $4.00.
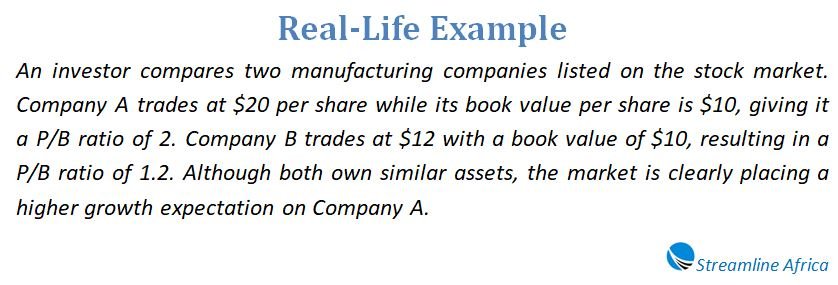
If the stock trades at $10 in the market, the P/B ratio is $10 ÷ $4.00 = 2.5. This means investors are willing to pay $2.50 for every dollar of the company’s net assets. Whether this is fair depends on how that company compares with its industry peers and whether investors expect strong growth ahead.
Tangible Versus Intangible Assets
Not all assets are equal in the eyes of accounting. Intangible items—such as goodwill, brand recognition, and intellectual property—are harder to quantify and can distort the usefulness of the P/B ratio. To address this, analysts sometimes use the price-to-tangible-book ratio (PTBV), which removes intangible assets from the calculation.
This version of the ratio is especially useful when assessing companies where intangible assets make up a large portion of their balance sheet.
Where the Ratio Falls Short
Like any financial metric, the P/B ratio has its drawbacks. It relies on accounting values, which may not reflect the true market worth of a company’s assets. Accounting rules differ across countries and industries, making it difficult to compare ratios across borders.
Additionally, companies in service or technology sectors often have fewer tangible assets, making the P/B ratio less reliable. In some cases, firms with long histories of negative earnings can see their book values turn negative, rendering the ratio meaningless.
Distortions in Book Value
Book value can be influenced by unusual corporate events. For instance, a recent acquisition may introduce goodwill that inflates book value, while a write-off can lower it dramatically. Share buybacks also affect the calculation by reducing outstanding shares, which can make the book value per share appear higher.
Because of these potential distortions, investors rarely rely on the P/B ratio alone. Instead, they combine it with other valuation measures, such as price-to-earnings (P/E) and price-to-sales (P/S) ratios.
Comparing P/B With Other Ratios
The P/B ratio is most effective when used alongside other indicators. For instance, high-growth companies often display P/B ratios well above one, which may be justified if their revenues and profits are climbing quickly. On the other hand, companies in distress might show ratios below one, but without the prospect of recovery, these could be value traps rather than bargains.
Another complementary metric is the price-to-sales ratio, which relates a company’s market value to its revenue. When viewed together, these ratios give a clearer picture of how the market perceives a company’s strength.
Why the P/B Ratio Matters
The importance of the P/B ratio lies in its ability to highlight potential investment opportunities. For value investors, it helps in spotting stocks that are priced lower than the value of their underlying assets. Meanwhile, growth-focused investors may use it as a check to avoid overpaying for companies with inflated valuations.
While not foolproof, the ratio brings balance to investment decisions by forcing a comparison between market enthusiasm and hard accounting numbers.
Determining What Counts as a “Good” P/B Ratio
Whether a P/B ratio is considered attractive depends on the industry context and the economic environment. In capital-intensive industries, a lower ratio may be expected and even desirable. In contrast, in fast-growing sectors like technology, higher ratios might be the norm.
Ultimately, a “good” ratio is relative—it reflects what is typical for similar companies in the same space, not a fixed standard across the board.
Final Take-Home
The price-to-book ratio remains one of the classic tools in the valuation toolkit. It tells investors how much the market is paying for a company’s net assets and provides a starting point for deeper analysis. A ratio below one may hint at an undervalued stock, while a higher number could indicate overvaluation—or simply strong growth expectations. Investors who use the P/B ratio wisely understand its strengths and limitations. By pairing it with other financial metrics and considering industry norms, they can make more informed choices and avoid the pitfalls of relying on a single figure. In the end, the P/B ratio serves as both a compass and a caution sign in the complex landscape of stock investing.