When people talk about the health of a country’s economy, one number often dominates the conversation: GDP. Short for Gross Domestic Product, GDP is a key economic indicator that shows us how much a country produces in terms of goods and services over a specific time period. But behind the number lies a deeper story about the nation’s growth, productivity, and even the quality of life of its people. This comprehensive guide will walk you through what GDP means, how it’s calculated, why it matters to governments and investors, and where its limitations lie. Whether you’re a student, business leader, or curious citizen, understanding GDP helps you grasp the broader economic picture of the world around you.
What Does GDP Really Mean?
At its core, GDP measures the total monetary value of everything produced within a country’s borders over a set period—usually a quarter or a year. It includes the value of all finished goods and services, ranging from clothing and electronics to professional services and infrastructure construction. Think of GDP as the economy’s scoreboard. When GDP is rising, it usually means businesses are doing well, employment is up, and incomes are growing. When GDP is falling, it can indicate that economic activity is slowing down, potentially leading to job losses or recessions.
The Four Main Components of GDP
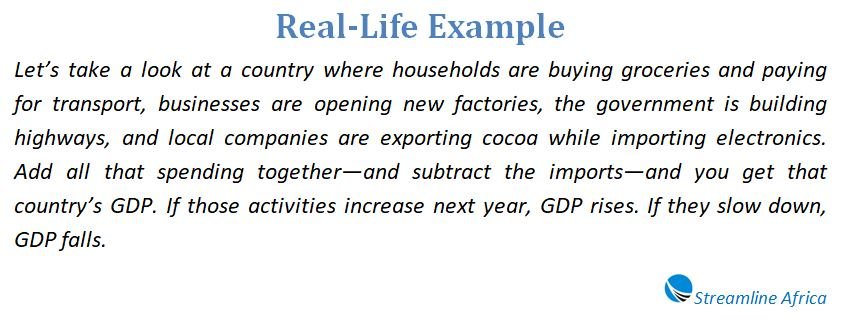
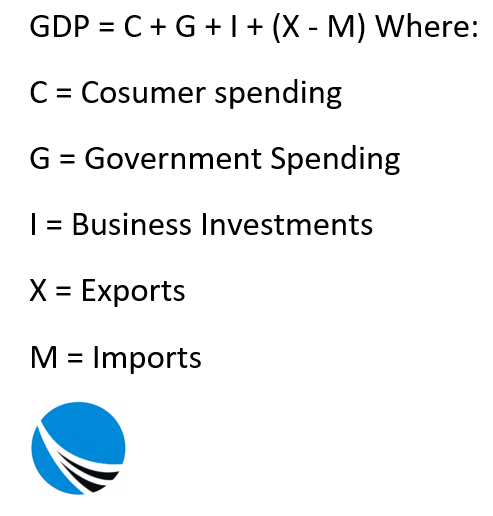
To calculate GDP, economists break it down into four categories: 1. Consumer Spending (C): This includes everything households spend money on, from groceries and healthcare to entertainment and housing. 2. Government Spending (G): Governments also buy goods and services—everything from teacher salaries to road construction counts here. 3. Business Investment (I): Companies invest in new factories, machines, and technology to grow. These investments play a key role in economic productivity. 4. Net Exports (NX): Exports add to GDP because they’re products made locally and sold abroad. Imports are subtracted since they represent foreign production consumed domestically. Net exports = Exports – Imports. When you put it all together, the most common formula used to compute GDP is: GDP = C + G + I + (X – M) Where X is exports and M is imports.
Different Ways to Calculate GDP
GDP can be approached from multiple angles, and each provides a slightly different perspective:
The Expenditure Approach
This is the most widely used method. It calculates the total spending on the country’s final goods and services. This method aligns with the C + G + I + (X – M) formula and focuses on what people, businesses, and the government are buying.
The Production (or Output) Approach
Instead of looking at spending, this method starts with the value of all goods and services produced in the economy and subtracts the cost of intermediate goods used in production. It gives us a sense of the economy’s raw output.
The Income Approach
This approach tallies all the income earned by the people and businesses involved in producing those goods and services. It includes wages, interest, rents, and profits. Adjustments are made for taxes, subsidies, and depreciation to arrive at the final GDP figure. Each method should, in theory, produce the same result if calculated accurately.
Nominal vs Real GDP: Why It Matters
Not all GDP figures are created equal. When analyzing growth, economists make a distinction between nominal GDP and real GDP. Nominal GDP measures the value of output using current prices. While this is useful for capturing immediate figures, it doesn’t account for inflation. Real GDP adjusts for inflation, using prices from a base year to give a more accurate reflection of actual growth in output. Let’s say a country’s nominal GDP doubled in 10 years. If prices also doubled during that time, the real GDP might show that there was no actual increase in production—just a rise in prices. That’s why real GDP is often seen as the better indicator of economic performance over time.
GDP Per Capita: A Closer Look at Living Standards
GDP per capita takes the overall GDP and divides it by the population size. This tells us how much output or income each individual, on average, contributes to or receives in the economy. This metric helps make more meaningful comparisons between countries. For example, a large country like India may have a massive GDP, but its GDP per capita could be lower than that of a much smaller country like Luxembourg. Still, this measure has its blind spots. GDP per capita doesn’t account for inequality or the cost of living. So, even if two countries have similar GDP per capita, the experience of living in them can be very different.
Purchasing Power Parity (PPP) and GDP
To get around some of the issues with cost-of-living differences between countries, economists use Purchasing Power Parity (PPP). This method adjusts GDP to reflect what people can actually buy with their income in each country. Imagine buying a loaf of bread in Ghana for 5 cedis and the same loaf costs $3 in the U.S. If you earn 50 cedis or $30, you’d buy more bread in Ghana. PPP adjusts for that, helping compare how much people can afford across countries more fairly.
Understanding the GDP Growth Rate
The GDP growth rate shows how fast a country’s economy is expanding or contracting. It compares one period (usually quarterly or annually) to a previous one and is expressed as a percentage. A positive growth rate means economic expansion, while a negative rate may suggest a slowdown or recession. Policymakers watch this rate closely: too much growth can lead to inflation, while too little might push a country toward economic stagnation. Central banks often adjust interest rates based on GDP growth to either stimulate the economy or cool it down.
GDP vs GNP vs GNI: What’s the Difference?
While GDP is the most talked-about measure, other metrics like Gross National Product (GNP) and Gross National Income (GNI) offer alternative views. GDP focuses on everything produced within a country’s borders, regardless of who owns the production. GNP counts all production by a country’s citizens and businesses, even if it happens abroad, and excludes foreign businesses operating domestically. GNI takes GNP a step further by adjusting for income earned and paid to foreign entities, offering a more precise look at what stays within a country. For example, a country like Ireland, which hosts many foreign companies, may have a high GDP but a much lower GNI because much of the profit leaves the country.
GDP and Its Limitations
GDP is a powerful tool, but it’s far from perfect. Here are a few of its biggest shortcomings:
It Doesn’t Capture Informal Activity
Many countries have large informal economies—think street vendors, barter systems, or under-the-table work. These contributions often go unmeasured in GDP statistics.
It Ignores Environmental and Social Costs
GDP can rise even if that growth comes from unsustainable practices. Building more factories boosts GDP, but if it leads to pollution and health issues, is that really progress?
It Overlooks Wealth Distribution
A high GDP doesn’t mean everyone in the country is doing well. It’s entirely possible for GDP to rise while inequality widens and poverty deepens.
It Counts “Bad” Spending
GDP includes government and private spending, regardless of whether it improves quality of life. Spending on war, disasters, or fixing pollution is counted the same as spending on education or healthcare.
Using GDP for Business and Policy Decisions
Despite its flaws, GDP remains essential for governments, investors, and businesses. It helps shape economic policies, forecast growth, and assess risks. Governments use GDP trends to adjust taxes, interest rates, and public spending. If GDP is slowing, a government may launch stimulus efforts. If it’s growing too fast, they may tighten policies to avoid inflation. For businesses, GDP helps in planning. Expanding during economic booms or holding back during downturns are common strategies tied to GDP data.
How Investors Use GDP
Investors track GDP to understand the overall business climate. High GDP growth often leads to better corporate earnings, while contractions may signal weaker returns. One specific tool investors use is the market-cap-to-GDP ratio, which compares the total value of a country’s stock market to its GDP. A very high ratio may suggest that the market is overvalued; a very low one might indicate opportunities. However, because GDP data is only released quarterly and often revised later, investors typically combine it with other real-time indicators for a fuller picture.
Where to Find Reliable GDP Data
If you’re looking to dive deeper into GDP figures, these sources are considered trustworthy: The World Bank: Offers global comparisons and historical trends. The International Monetary Fund (IMF): Tracks GDP across countries and publishes forecasts. The Organisation for Economic Co-operation and Development (OECD): Focuses on member and partner countries. The U.S. Bureau of Economic Analysis (BEA): The official source for American GDP data, offering detailed breakdowns. These organizations provide downloadable data sets, visualizations, and analysis, useful for both casual readers and researchers.
A Look at GDP in History
GDP as a concept was introduced during the 1930s by economist Simon Kuznets to help assess the American economy during the Great Depression. It became the global standard after World War II, replacing GNP in most countries. Over time, criticisms grew. Some economists argue GDP gives too much weight to economic output while ignoring well-being, sustainability, and inequality. These critiques have led to the rise of alternative indicators like the Human Development Index (HDI) and Genuine Progress Indicator (GPI). Still, GDP remains the go-to metric for measuring economic activity.
Final Thoughts: What GDP Can and Can’t Tell You
Gross Domestic Product is like a wide-angle lens capturing the movement and momentum of an economy. It tells you whether output is growing, shrinking, or staying steady. It helps policymakers plan for recessions or inflation and gives businesses the confidence to invest or hold back. But GDP doesn’t tell you everything. It won’t tell you if people are happy, if wealth is evenly distributed, or if growth is sustainable. For that, you’ll need to look beyond GDP and consider broader measures of human development. Understanding GDP is a solid first step toward becoming more economically literate. But it’s just one piece of a much larger puzzle in understanding the world’s economies—and the lives they shape.
Frequently Asked Questions about GDP
How Is GDP Calculated?
GDP is usually calculated using the expenditure method: GDP = Consumer Spending + Government Spending + Business Investment + (Exports – Imports). This approach captures everything spent within the economy.
What’s The Difference Between Nominal And Real GDP?
Nominal GDP uses current prices and doesn’t factor in inflation, while real GDP adjusts for inflation to reflect actual economic growth more accurately over time.
Why Is Real GDP More Reliable Than Nominal GDP?
Real GDP shows true economic progress by filtering out the effects of inflation. It helps distinguish whether growth comes from increased output or just rising prices.
What Does GDP Per Capita Tell Us?
GDP per capita divides total GDP by population, giving a rough idea of the average income or economic productivity per person in a country.
What Is Purchasing Power Parity (PPP) And How Does It Relate To GDP?
PPP adjusts GDP to reflect local living costs and price levels. It gives a clearer comparison of what people can afford across different countries.
How Can GDP Growth Impact Economic Policy?
When GDP grows quickly, central banks may raise interest rates to prevent inflation. If GDP shrinks or slows, they might cut rates or inject money to stimulate the economy.
What Are The Limitations Of GDP?
GDP doesn’t account for wealth inequality, informal work, environmental impact, or overall happiness. It measures output, not well-being.
How Do GNP And GNI Differ From GDP?
GNP focuses on the output of a country’s citizens, even if produced abroad. GNI goes further by adjusting for income sent in or out of the country, giving a fuller income picture.
How Do Investors Use GDP Data?
Investors watch GDP to judge the economic climate. Strong growth can mean better corporate earnings, while weak GDP might signal caution or opportunity depending on market context.