Across Africa, personal income taxation tells a story that goes far beyond percentages. It reflects how governments balance growth, fairness, and fiscal survival. While every country taxes income, the rates applied—and how they are structured—differ widely, revealing unique economic priorities and policy philosophies.
To better understand this landscape, it helps to move beyond general observations and examine actual country data. When arranged from the lowest to the highest top personal income tax rates, a clearer picture emerges of how African nations position themselves on the spectrum of taxation.
Personal Income Tax Rates Ranked from Lowest to Highest
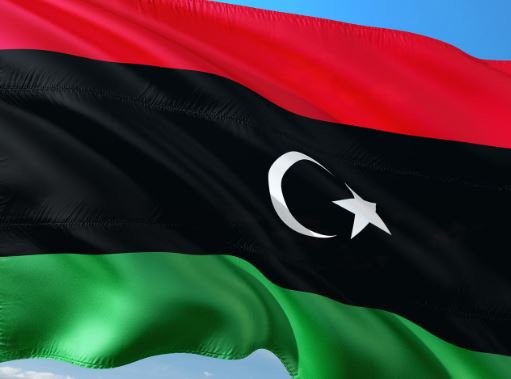
At the lower end of the scale, a few countries maintain minimal tax burdens on personal income. Libya stands out with a top rate of just 10%, making it one of the most lenient tax environments on the continent. Similarly, Seychelles and Sudan apply modest rates of 15%, keeping personal taxation relatively light.
Moving slightly upward, countries like Guinea, Madagascar, and Mauritius each set their top rates at 20%. These nations often aim to strike a balance between attracting investment and maintaining steady government revenue.
In the lower-middle range, Nigeria applies a 24% rate, while Angola, Botswana, and Equatorial Guinea cluster around 25%. Egypt follows with 27.5%, showing a gradual increase as economies expand and revenue needs grow.
The mid-tier group features a number of countries with rates around 30%. Chad, Lesotho, Rwanda, Tanzania, and Sierra Leone all fall into this category. Mozambique sits slightly higher at 32%, while Swaziland follows at 33%.
A more noticeable jump occurs in the upper-middle bracket. Algeria, Ethiopia, Gabon, Gambia, Ghana, and Kenya all apply a 35% top rate. Namibia and Zambia increase this slightly to 37%, while Morocco reaches 38% and Cameroon stands at 38.5%.
At the higher end, taxation becomes significantly steeper. Congo and Republic of the Congo both impose 40%, alongside Malawi, Mauritania, Tunisia, and Uganda. Zimbabwe pushes slightly higher at 41.2%, followed by Senegal at 43%.
At the very top sits South Africa with a 45% personal income tax rate, the highest among the listed nations. This reflects a strong emphasis on revenue mobilization and redistribution.
Read Also: Ghana Corporate Taxes Explained: Rates, Levies, And Compliance Guide For Businesses
What These Rankings Reveal
Arranging the data from lowest to highest reveals more than just numbers—it highlights strategic differences. Countries with lower tax rates often prioritize economic stimulation, aiming to attract entrepreneurs, investors, and skilled professionals. These environments can encourage business growth and higher disposable income.
On the other hand, higher-tax countries tend to focus on funding public services and addressing inequality. With greater fiscal demands, these governments rely more heavily on income taxation to sustain national development programs.
Interestingly, the majority of African countries cluster between 30% and 40%. This suggests a common effort to balance competitiveness with the need for reliable revenue streams.
The Human Impact Behind the Numbers
Consider two individuals: Mariam, a marketing executive in Mauritius, and Thabo, an engineer in South Africa. Mariam benefits from a relatively low 20% tax rate, allowing her to save and invest more aggressively. Thabo, however, operates under a 45% rate, meaning a larger portion of his income supports public infrastructure, healthcare, and education systems.
These differences shape not only personal financial decisions but also career mobility. Skilled workers may gravitate toward lower-tax jurisdictions, while others may accept higher taxes in exchange for stronger public services.
Shifting Policies and Emerging Trends
The data also hints at change. Some countries have adjusted their rates recently—either increasing them to boost revenue or lowering them to remain competitive. For instance, shifts in countries like Sierra Leone and Gambia indicate ongoing policy recalibration.
Across the continent, there is growing recognition that simply raising tax rates is not always the solution. Governments are increasingly exploring ways to widen the tax base, improve compliance, and digitize tax collection systems.
A Continent of Strategic Choices
Africa’s personal income tax landscape is far from uniform. From the low-tax approach of Libya to the high-tax framework of South Africa, each country reflects a deliberate policy choice shaped by its economic realities.
Ultimately, these tax systems are not just about revenue—they are tools that influence behavior, shape opportunities, and define the relationship between citizens and the state. Understanding where each country stands offers valuable insight into the broader direction of economic policy across the continent.
Personal Income Tax Table for African Countries
This table presents a comparative overview of top personal income tax rates across selected African countries, arranged from the lowest to the highest. It highlights both current and previous rates, offering a quick snapshot of how tax policies differ across the continent and where recent adjustments have occurred.
| Country | Current Tax Rate (%) | Previous Tax Rate (%) |
|---|---|---|
| Libya | 10 | 10 |
| Seychelles | 15 | 15 |
| Sudan | 15 | 15 |
| Guinea | 20 | 20 |
| Madagascar | 20 | 20 |
| Mauritius | 20 | 20 |
| Nigeria | 24 | 24 |
| Angola | 25 | 25 |
| Botswana | 25 | 25 |
| Equatorial Guinea | 25 | 35 |
| Egypt | 27.5 | 27.5 |
| Chad | 30 | 30 |
| Lesotho | 30 | 30 |
| Rwanda | 30 | 30 |
| Tanzania | 30 | 30 |
| Sierra Leone | 30 | 15 |
| Mozambique | 32 | 32 |
| Swaziland | 33 | 33 |
| Algeria | 35 | 35 |
| Ethiopia | 35 | 35 |
| Gabon | 35 | 35 |
| Gambia | 35 | 25 |
| Ghana | 35 | 35 |
| Kenya | 35 | 35 |
| Namibia | 37 | 37 |
| Zambia | 37 | 37 |
| Morocco | 38 | 38 |
| Cameroon | 38.5 | 38.5 |
| Congo | 40 | 40 |
| Republic of the Congo | 40 | 40 |
| Malawi | 40 | 35 |
| Mauritania | 40 | 40 |
| Tunisia | 40 | 35 |
| Uganda | 40 | 40 |
| Zimbabwe | 41.2 | 41.2 |
| Senegal | 43 | 43 |
| South Africa | 45 | 45 |