
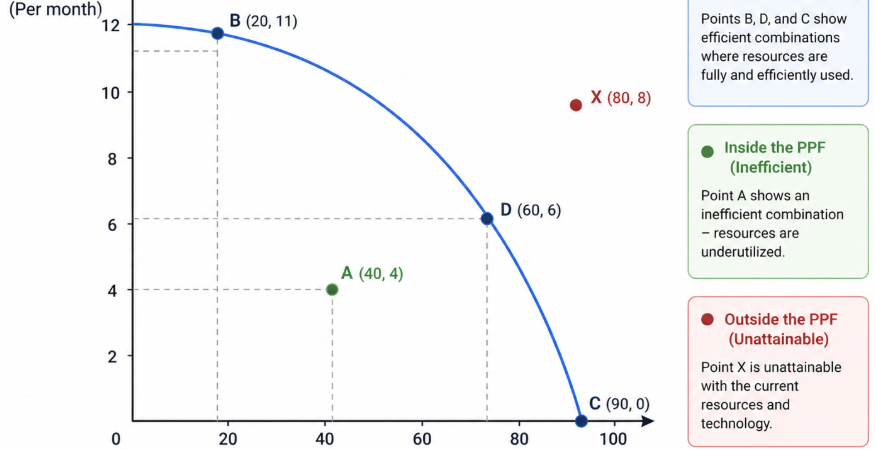
In economics, the production possibility frontier (often abbreviated as PPF and sometimes called the production possibility curve) is a visual framework used to show the maximum combinations of two goods or services that can be produced within an economy or organization when resources are limited. Rather than being just a theoretical line on a graph, the PPF captures a central reality of economic life: scarcity forces choices. Every decision to increase the output of one good inevitably reduces the capacity to produce another.
The model simplifies reality by focusing on two outputs, but its implications extend broadly—from individual decision-making to national economic planning. It is a practical tool for illustrating efficiency, trade-offs, and the consequences of resource allocation.
The Logic Behind the Curve
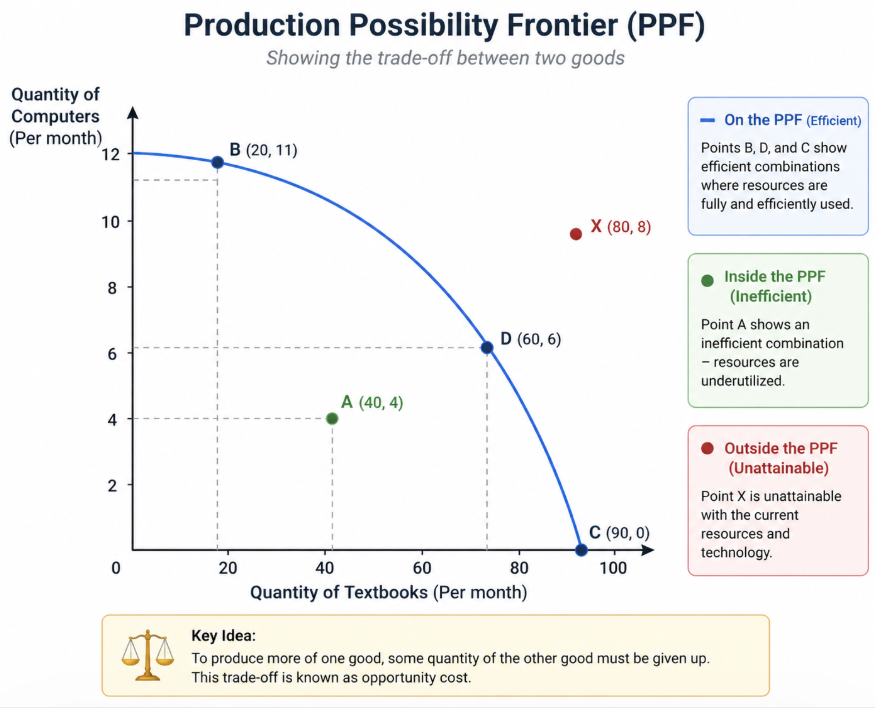
At its core, the PPF represents the boundary between what is achievable and what is unattainable. Any point along the curve reflects the most efficient use of available resources. Producing at this level means that all inputs—such as labor, capital, and raw materials—are fully utilized with no waste.
Points located inside the curve indicate inefficiency. In such cases, an economy or firm is underperforming, either because resources are idle or because they are not being used optimally. On the other hand, any point outside the curve represents a level of production that cannot be achieved with the current resource base and technology.
This framework highlights a key economic principle: resources are finite, and choices must be made about how best to allocate them.
Assumptions That Shape the Model
To interpret the PPF correctly, it is important to understand the assumptions that underpin it. First, the model assumes that only two goods are being produced. This simplification allows for clear graphical representation, though real economies produce a wide range of goods and services.
Second, the availability of resources is considered fixed. This means that the quantities of labor, land, and capital do not change during the analysis. Third, technology is assumed to remain constant, implying that production methods do not improve or deteriorate. Finally, the model assumes that resources are used efficiently, meaning there is no waste or misallocation.
While these assumptions may not fully reflect real-world complexity, they provide a controlled environment for analyzing economic behavior.
Opportunity Cost and Trade-Offs
One of the most powerful insights offered by the PPF is the concept of opportunity cost. When an economy chooses to produce more of one good, it must give up some quantity of another good. This sacrifice is the opportunity cost of the decision.
For instance, imagine a system that produces textbooks and computers. Increasing textbook production requires shifting resources away from computer manufacturing. The number of computers forgone represents the cost of producing additional textbooks. This trade-off is not constant; it often increases as more resources are reallocated, especially when resources are better suited for one type of production than another.
The slope of the PPF at any given point reflects this trade-off and is known as the marginal rate of transformation. It indicates how much of one good must be sacrificed to gain an additional unit of the other.
Efficiency and Resource Allocation
Efficiency is a central theme in the analysis of the PPF. When production occurs on the curve, the economy is said to be productively efficient. This means that it is impossible to increase the output of one good without decreasing the output of another.
However, productive efficiency does not necessarily imply that the chosen combination of goods is the most desirable. This brings in the concept of allocative efficiency, which considers whether the mix of goods aligns with societal preferences. Even if an economy operates on the PPF, it may still produce the wrong combination of goods if it does not reflect consumer needs.
Another related concept is Pareto efficiency, named after the Italian economist Vilfredo Pareto. A situation is Pareto efficient if no reallocation can make one party better off without making another worse off. Points along the PPF can be Pareto efficient, but not all of them necessarily satisfy this condition.
Application in Business Decision-Making
Businesses frequently rely on PPF-like reasoning when deciding how to allocate limited resources. Consider a manufacturing firm that produces two products. By plotting different combinations of output, the firm can identify the most efficient production levels.
If the company operates inside the curve, it signals inefficiency—perhaps due to underutilized labor or outdated processes. Moving toward the frontier improves productivity without requiring additional resources. Conversely, attempting to produce beyond the curve is unrealistic unless the firm invests in new technology or expands its resource base.
The PPF also helps managers evaluate strategic trade-offs. For example, focusing heavily on one product line may increase specialization but could limit diversification and flexibility.
National Economic Perspective
On a larger scale, the PPF is used to analyze how entire economies allocate their resources. A country might choose between producing consumer goods, such as food and clothing, and capital goods, such as machinery and infrastructure. The balance between these categories influences both current living standards and future growth potential.
If an economy operates inside its PPF, it suggests underemployment or inefficiencies, such as unused labor or capital. Governments may respond with policies aimed at boosting productivity, such as investing in education or improving infrastructure.
Markets also play a critical role in determining where an economy operates along the PPF. Prices, consumer demand, and resource availability all influence production decisions, guiding the allocation of resources toward more valued uses.
Movement and Shifts of the Frontier
The position of the PPF is not fixed. It can shift outward or inward depending on changes in key factors. Economic growth, driven by increased resources or technological advancement, pushes the curve outward. This expansion means that more of both goods can be produced without sacrificing one for the other.
For example, improvements in agricultural technology can increase food production without reducing industrial output. Similarly, an increase in the labor force or capital investment can enhance overall production capacity.
Conversely, the PPF can shift inward due to negative events such as natural disasters, resource depletion, or economic crises. These factors reduce an economy’s ability to produce, limiting its potential output.
It is also possible for the curve to shift unevenly. Technological progress that benefits one sector more than another can cause the frontier to expand more in one direction, reflecting a bias toward a particular type of production.
Shape of the Curve and Its Meaning
In most cases, the PPF is drawn as a curve that bows outward from the origin. This shape reflects increasing opportunity costs. As production becomes more specialized, resources that are less suited for a particular good must be used, making each additional unit more costly in terms of forgone alternatives.
However, the curve can take different forms under certain conditions. A straight-line PPF indicates constant opportunity costs, which occurs when resources are perfectly adaptable between uses. In rare cases, the curve may bend inward, suggesting decreasing opportunity costs due to factors like economies of scale or specialization.
The shape of the curve provides valuable insights into how easily resources can be reallocated between different types of production.
Broader Economic Insights
Beyond its graphical representation, the PPF encapsulates several foundational economic ideas. It demonstrates scarcity, as resources are limited. It highlights trade-offs, showing that choices involve costs. It emphasizes efficiency, illustrating the importance of maximizing output with available inputs.
The model also sheds light on the importance of growth and innovation. Expanding the PPF requires improvements in technology, increases in resources, or better management practices. Without such changes, economies remain constrained by their existing limitations.
A Simple Way to Think About It
At a basic level, the PPF can be understood as a boundary of possibilities. Imagine having a fixed amount of ingredients to bake either bread or cakes. Making more bread leaves fewer ingredients for cakes. The curve represents all the combinations you can realistically produce without wasting anything.
This simple analogy captures the essence of the concept: choices must be made, and every choice has a cost.
Final Perspective
The production possibility frontier remains one of the most widely used tools in economic analysis because it distills complex realities into a clear and intuitive framework. Whether applied to a small business or an entire nation, it helps decision-makers understand limits, evaluate trade-offs, and pursue efficiency.
By examining where production lies relative to the curve, analysts can identify inefficiencies, assess growth potential, and explore the impact of technological change. In a world defined by limited resources and competing needs, the PPF offers a structured way to think about how best to use what is available.
Commonly Asked Questions
Why is the PPF important in economics?
It serves as a foundational tool for understanding scarcity, efficiency, and trade-offs. Economists and businesses rely on it to evaluate how resources should be allocated for optimal results.
What is opportunity cost in the context of the PPF?
Opportunity cost is what you give up when choosing to produce more of one good over another. The PPF makes this trade-off visible by showing how increasing one output reduces the other.
What do points inside the curve represent?
Points inside the curve indicate inefficiency. This means resources are either underutilized or not being used in the best possible way.
What does it mean if production is on the curve?
When production lies on the PPF, it reflects maximum efficiency. All available resources are fully utilized, and output cannot be increased without sacrificing something else.
Why are points outside the curve unattainable?
Points beyond the curve require more resources or better technology than currently available, making them impossible to achieve under existing conditions.
What causes the PPF to shift outward?
Economic growth, technological improvements, and an increase in resources such as labor or capital can expand production capacity, shifting the curve outward.
Can the PPF shift inward, and why would it?
Yes, it can contract due to events like natural disasters, economic decline, or loss of resources, reducing the economy’s ability to produce goods.
How does the shape of the PPF affect interpretation?
A curved PPF reflects increasing opportunity costs, while a straight line suggests constant trade-offs. The shape reveals how easily resources can be reallocated.
What is the role of Vilfredo Pareto in relation to the PPF?
His concept of Pareto efficiency helps explain which points on the PPF represent optimal allocation—where improving one outcome would worsen another.