
Return on average assets, shortened to ROAA, measures how successfully a company converts its asset base into net income. Instead of considering profit in isolation, the ratio evaluates the amount earned in relation to the resources used to produce it. This makes ROAA an important indicator of operating efficiency, particularly for banks and other financial institutions whose activities depend heavily on loans, securities, cash, buildings, and technology systems.
The word “average” is central to the calculation. A balance sheet reports assets at one specific date, but a company’s asset position may change considerably during the year. It may purchase equipment, expand lending, sell property, acquire another business, or reduce investments. Using only the opening or closing balance can therefore create a misleading picture. ROAA combines the beginning and ending asset values to provide a more balanced estimate of the resources employed throughout the period.
Why ROAA Is Important in Finance
A large profit figure does not automatically mean that a company has used its assets efficiently. Suppose two banks each earn $10 million. If the first holds average assets of $500 million and the second holds $2 billion, the first bank has generated the same income from a much smaller resource base. ROAA makes that difference visible.
Assets also carry costs and risks. Buildings require maintenance, equipment loses value, loans may become uncollectible, and investments can decline when market conditions change. A business that continually adds assets without achieving corresponding earnings growth may appear larger while becoming less productive. By connecting net income from the income statement with assets from the balance sheet, ROAA helps management and investors determine whether expansion is creating meaningful value.
The ratio works best when companies are compared with close competitors. A bank, airline, manufacturer, and software company have very different asset needs. Digital businesses can sometimes produce significant revenue with limited physical property, while banks and industrial companies operate with large balance sheets. Cross-industry comparisons may therefore lead to weak conclusions.
How to Calculate ROAA
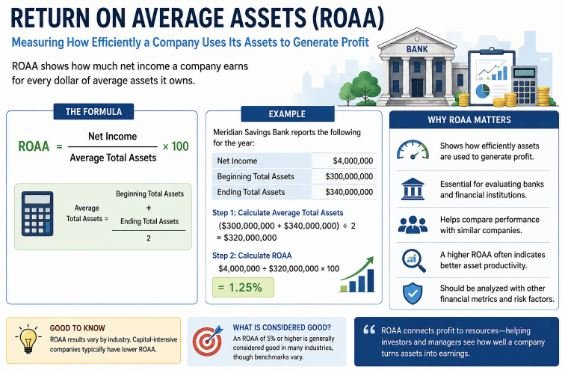
ROAA is calculated by dividing net income for a reporting period by average total assets for that same period. The result is then multiplied by 100 to express it as a percentage.
ROAA = Net Income ÷ Average Total Assets × 100
Average total assets are normally calculated as follows:
Average Total Assets = (Beginning Total Assets + Ending Total Assets) ÷ 2
Net income is the profit remaining after operating expenses, interest, taxes, impairment charges, and other relevant costs have been recognized. It appears on the income statement. Total assets appear on the balance sheet and may include cash, customer loans, investments, receivables, property, equipment, inventory, and other controlled economic resources.
The reporting periods must match. Annual net income should be divided by average annual assets, while quarterly income should be matched with assets covering that quarter. Mixing different periods would weaken the accuracy of the result.
Why Analysts Use Average Assets
The income statement measures activity over time, but the balance sheet presents a snapshot at a particular date. This difference creates a measurement challenge. A year-end asset balance may be unusually high because a company completed an acquisition shortly before closing its accounts. It may also be unusually low because management sold assets or collected outstanding receivables near the reporting date.
Averaging the opening and closing amounts reduces the influence of these timing differences. It provides a denominator that is more representative of the resources available during the period in which the income was earned.
An Example of ROAA in Practice
Imagine that Meridian Savings Bank reports net income of $4 million for the year. Its total assets were $300 million at the beginning of the year and $340 million at the end.
Average total assets are calculated first:
($300 million + $340 million) ÷ 2 = $320 million
Net income is then divided by the average:
$4 million ÷ $320 million = 0.0125
After multiplying by 100, Meridian’s ROAA is 1.25%.
This means the bank earned $1.25 in net profit for every $100 of average assets used during the year. The percentage may seem small when compared with returns in other sectors, but banks generally operate with very large asset balances and narrow profit margins.
Using only beginning assets would produce a return of approximately 1.33%. Using only ending assets would produce about 1.18%. The average-based calculation falls between those results and better represents performance across the full year.
How ROAA Explains Bank Profitability
ROAA is particularly valuable for evaluating banks because most banking income is generated through assets. Customer loans earn interest, securities produce investment returns, and cash supports payment and liquidity obligations. The quality, pricing, and composition of those assets directly affect profitability.
An improving ROAA may reflect stronger lending margins, better expense control, fewer credit losses, improved asset quality, or a more profitable investment mix. A declining ratio may point to rising operating costs, weak loan demand, increasing defaults, excess cash, falling interest margins, or rapid asset growth that has not yet generated sufficient revenue.
Understanding High and Low ROAA Results
A higher ROAA generally suggests that management is producing more income from the assets under its control. However, the result should not be accepted without further investigation. A bank may improve its ratio by holding riskier loans, reducing liquidity, lowering credit provisions, or postponing necessary investment. These actions may raise short-term earnings while creating future vulnerability.
ROAA and ROA
Return on average assets and return on assets are sometimes presented as the same measure. They are identical when ROA is calculated with average total assets. The difference appears when ROA uses only the opening or closing asset balance.
ROAA deliberately uses an average, making it more useful when assets change sharply during the period. A rapidly expanding company could appear unusually profitable if income is divided only by opening assets. Conversely, using the larger closing balance could make the return look weaker than the performance achieved during most of the year.
ROAA and Return on Equity
Return on equity, or ROE, measures net income against shareholders’ equity. ROAA measures net income against the company’s entire asset base. ROE therefore concentrates on the return generated for owners, while ROAA considers the productivity of all resources controlled by the business.
The difference is important because assets may be financed through both equity and borrowed funds. A highly leveraged bank can report a strong ROE even when its ROAA remains modest. Examining both measures helps investors determine whether shareholder returns come from efficient operations, greater leverage, or a combination of the two.
ROAA and Return on Total Assets
Return on total assets, commonly called ROTA, resembles ROAA because both may use average total assets as the denominator. The main distinction is the income figure placed above it.
ROAA uses net income after interest and tax. ROTA commonly uses earnings before interest and taxes. ROTA therefore emphasizes operating returns before financing and taxation, while ROAA reflects the final profit remaining after those charges.
Limitations of the Ratio
ROAA is useful, but it cannot provide a complete judgment by itself. Accounting policies may influence both net income and asset values. Depreciation methods, loan-loss provisions, asset revaluations, impairment decisions, and unusual gains can materially change the percentage.
The ratio also says little about asset quality. Two banks may report the same ROAA even though one holds a conservative loan portfolio and the other earns higher returns from customers with greater default risk. Inflation, acquisitions, restructuring, and temporary market conditions can further reduce comparability.
Using ROAA for Better Decisions
Management can use ROAA to evaluate whether lending growth, investments, acquisitions, branches, equipment, and technology projects are producing acceptable returns. Investors can use the ratio to compare similar institutions, identify performance trends, and question whether asset expansion is improving shareholder value.
Ultimately, ROAA links resources with results. By dividing net income by average total assets, it shows how effectively a company turns its asset base into profit. The measure is most valuable when it is calculated consistently, compared within the same industry, and interpreted alongside strategy, risk, economic conditions, and other financial indicators.
Important Facts About ROAA
ROAA Measures Asset Efficiency
Return on average assets shows how effectively a company uses its available assets to generate net income.
Average Assets Improve Accuracy
The calculation uses the average of beginning and ending assets, helping to reduce distortions caused by major asset changes during the year.
The Formula Is Straightforward
ROAA is calculated by dividing net income by average total assets and multiplying the result by 100.
Banks Rely Heavily on ROAA
The ratio is especially useful for banks because loans, investments, cash, and other assets are central to their income-generating activities.

Industry Comparisons Matter
ROAA should be compared among companies in the same industry because asset requirements differ significantly across business sectors.
A Higher ROAA Often Signals Efficiency
An increasing ROAA may indicate stronger profitability, better cost management, improved asset quality, or more productive use of resources.
A Low ROAA Needs Context
A lower result does not always mean poor management, as asset-intensive companies may naturally produce smaller returns on large asset bases.
ROAA Differs From ROE
ROAA measures profit against total assets, while return on equity evaluates income in relation to shareholders’ funds.
ROAA Should Not Be Used Alone
Analysts should combine ROAA with measures such as asset quality, leverage, credit risk, operating costs, and return on equity before making decisions.